2.4 KiB
Introduction
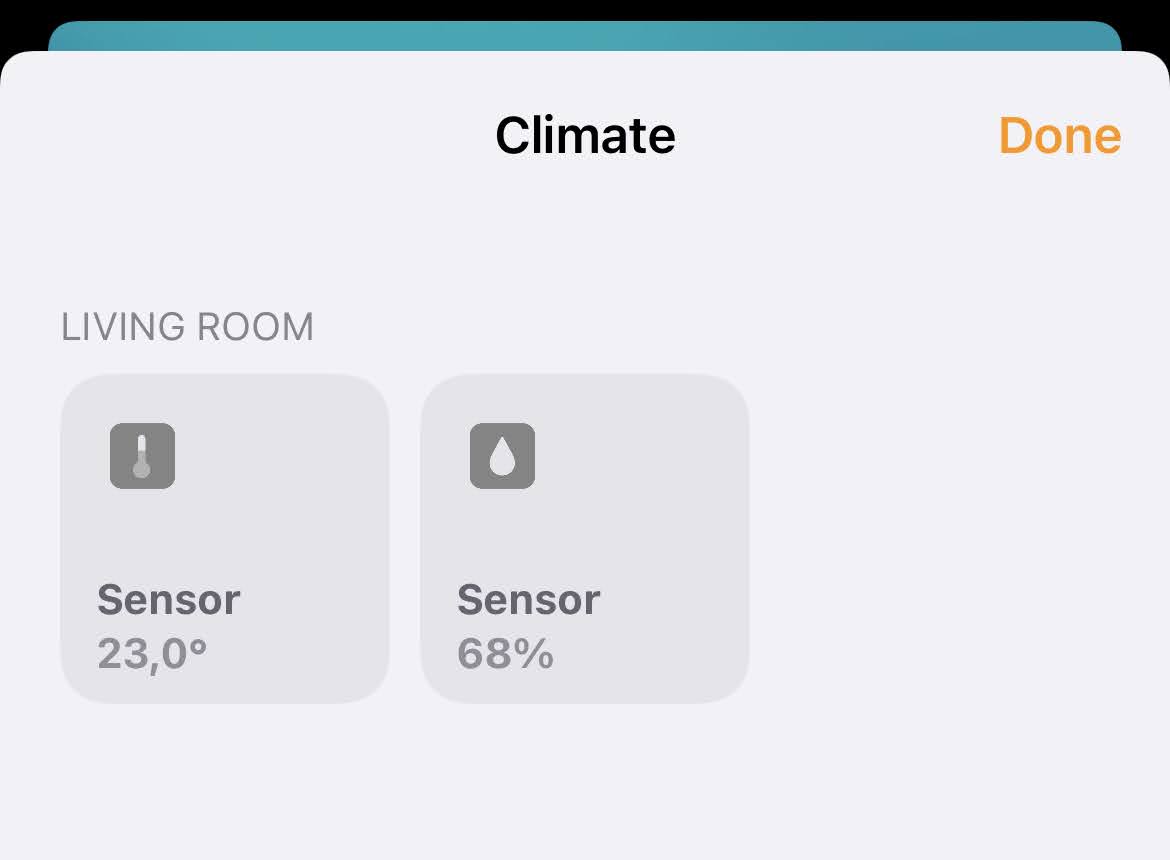
Simple script to add BME680 sensor readings to Apple Homekit using a Raspberry PI with minimal configuration.
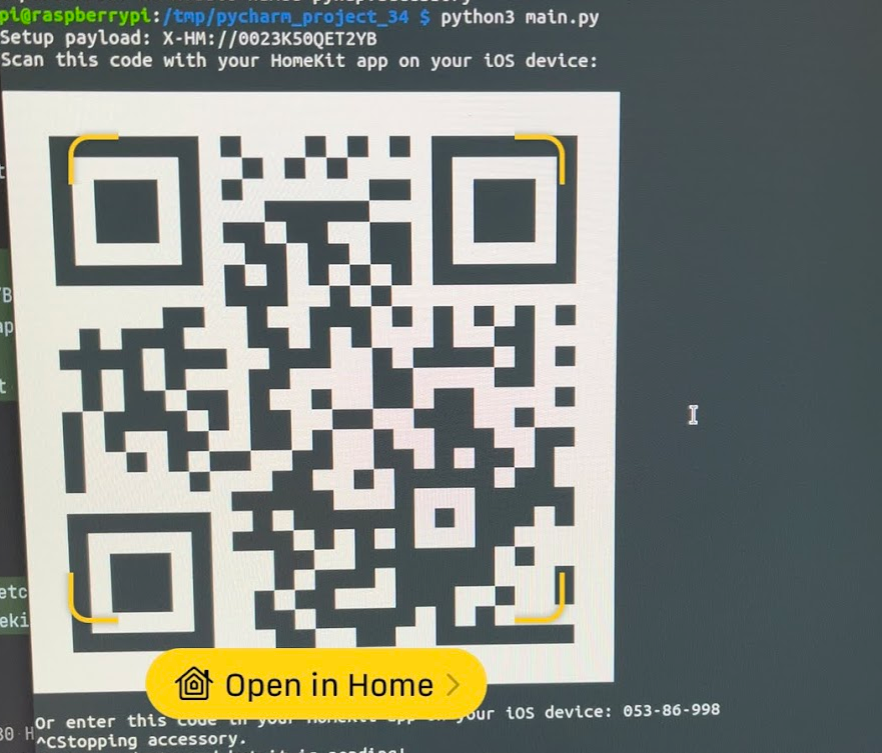
After running the program you'll be given the QR code used to add the sensor as an accessory in Homekit.
Installing
Ensure you are the pi user. Clone the repo in home and then install requirements.
Cloning the project
cd /home/pi && git clone git@github.com:dnutiu/bme680-homekit.git && cd bme680-homekit
sudo apt-get install libavahi-compat-libdnssd-dev
pip3 install -r requirements.txt
Sensors
The sensors directory contains code for operating the bme680 sensor.
The sensor values are collected and exposed in HomeKit and as prometheus metrics.
The prometheus metrics can be accessed on port 8000.
Run the program once to pair it with your ios. ex:
cd sensors
python3 main.py
Setup payload: X-HM://0023K50QET2YB
Scan this code with your HomeKit app on your iOS device:

Or enter this code in your HomeKit app on your iOS device: 053-86-998
Copy the systemd service.
sudo cp bme680-homekit.service /etc/systemd/system
sudo systemctl status bme680-homekit
● bme680-homekit.service - Bme680 Homekit service
     Loaded: loaded (/etc/systemd/system/bme680-homekit.service; disabled; vendor preset: enabled)
     Active: inactive (dead)
Start the service
sudo systemctl start bme680-homekit
sudo systemctl status bme680-homekit
● bme680-homekit.service - Bme680 Homekit service
     Loaded: loaded (/etc/systemd/system/bme680-homekit.service; disabled; vendor preset: enabled)
     Active: active (running) since Mon 2022-02-21 20:10:30 GMT; 935ms ago
   Main PID: 1722 (python3)
      Tasks: 1 (limit: 780)
        CPU: 895ms
     CGroup: /system.slice/bme680-homekit.service
             └─1722 /usr/bin/python3 /home/pi/bme680-homekit/main.py

Feb 21 20:10:30 raspberrypi systemd[1]: Started Bme680 Homekit service.
Prometheus
Prometheus is a system for monitoring and alerting. To install it run prometheus./install.sh.
Prometheus server will listen on port :9090
Grafana
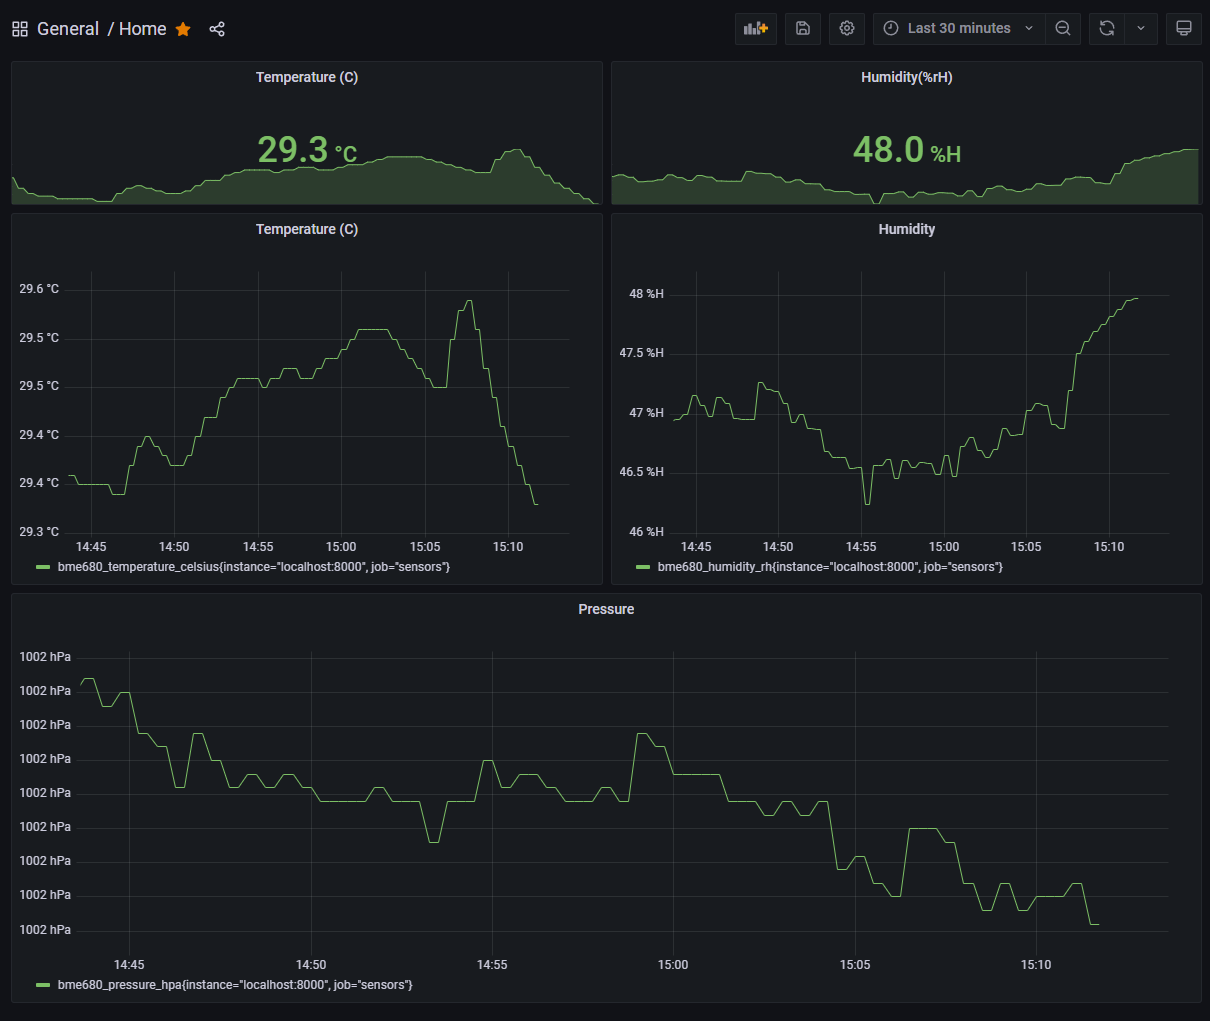
Grafana can be used to create dashboard and visualise prometheus metrics. To install it run grafana/install.sh
Grafana is accessible on port :80. Premade dashboards can be found in the grafana/dashboards folder.


